Automotive Lighting · Optical Design & Photometric Analysis

One trace.
Many ways to see the truth.

Ray Explorer connects CAD geometry, parametric optical design, native NVIDIA OptiX tracing, near-field luminance inspection, far-field photometry, road projection, and regulation engineering pre-checks in one project workflow.

CONFIDENTIAL · PROPRIETARY Vitor Santiago · Optical Design & Analysis Software
OPTIONAL VULKAN ZERO-COPY MEASURED VIEWPORT TEST
13.3M rays 58 FPS 4.0ms GPU render
Ray Explorer Dynamic Ray Viewer showing real-time 3D ray manipulation
Active Viewport · Dynamic Camera
GPU Render 4.0 ms (CUDA)
Presentation 13.3 ms (Vulkan)
Memory Architecture GPU-resident in supported Vulkan modes
Fallback Path Automatic OpenGL
03 Connected Workspaces CAD & OptiX · Near Field · Far Field & Road
0 / frame Host Image Readback For supported modes while the Vulkan/CUDA presenter is active
RAW Measurement Source ROI, profiles, and evaluations use underlying arrays—not display pixels
Escaped Rays as Evidence Reposition the virtual sensor without retracing escaped rays Enter Workspaces ↗
Core Architecture & Philosophy

A ray database should be a starting point, not a dead end.

In receiver-coupled workflows, changing the inspection plane or viewpoint can require an upstream sensor change and another simulation. Ray Explorer separates escaped-ray generation from downstream inspection so the same ray database can answer additional view and measurement questions.

STEP 01

Define Fixed Sensor

Position, orientation, and resolution are part of the simulation setup.

STEP 02

Run Full Simulation

Run the source simulation for the configured receiver.

STEP 03

Review Static Map

Review the result produced for that receiver definition.

BOTTLENECK

Need New Angle?

Modify the receiver and rerun when the upstream tool cannot reuse escaped rays.

Receiver-Coupled Tradeoff: A new inspection question can become a new simulation when receiver geometry is embedded upstream.
Ray Explorer Architecture: Trace or import escaped rays $\rightarrow$ reposition the virtual sensor $\rightarrow$ calculate profiles, ROI statistics, homogeneity, and far-field outputs without retracing the optical scene.
4 CONNECTED MODULES IN ONE ENGINEERING LOOP

Explore the Ray Explorer Workspace Suite

WORKSPACE 01 / NEAR FIELD

Dynamic Viewport & Quantitative Luminance

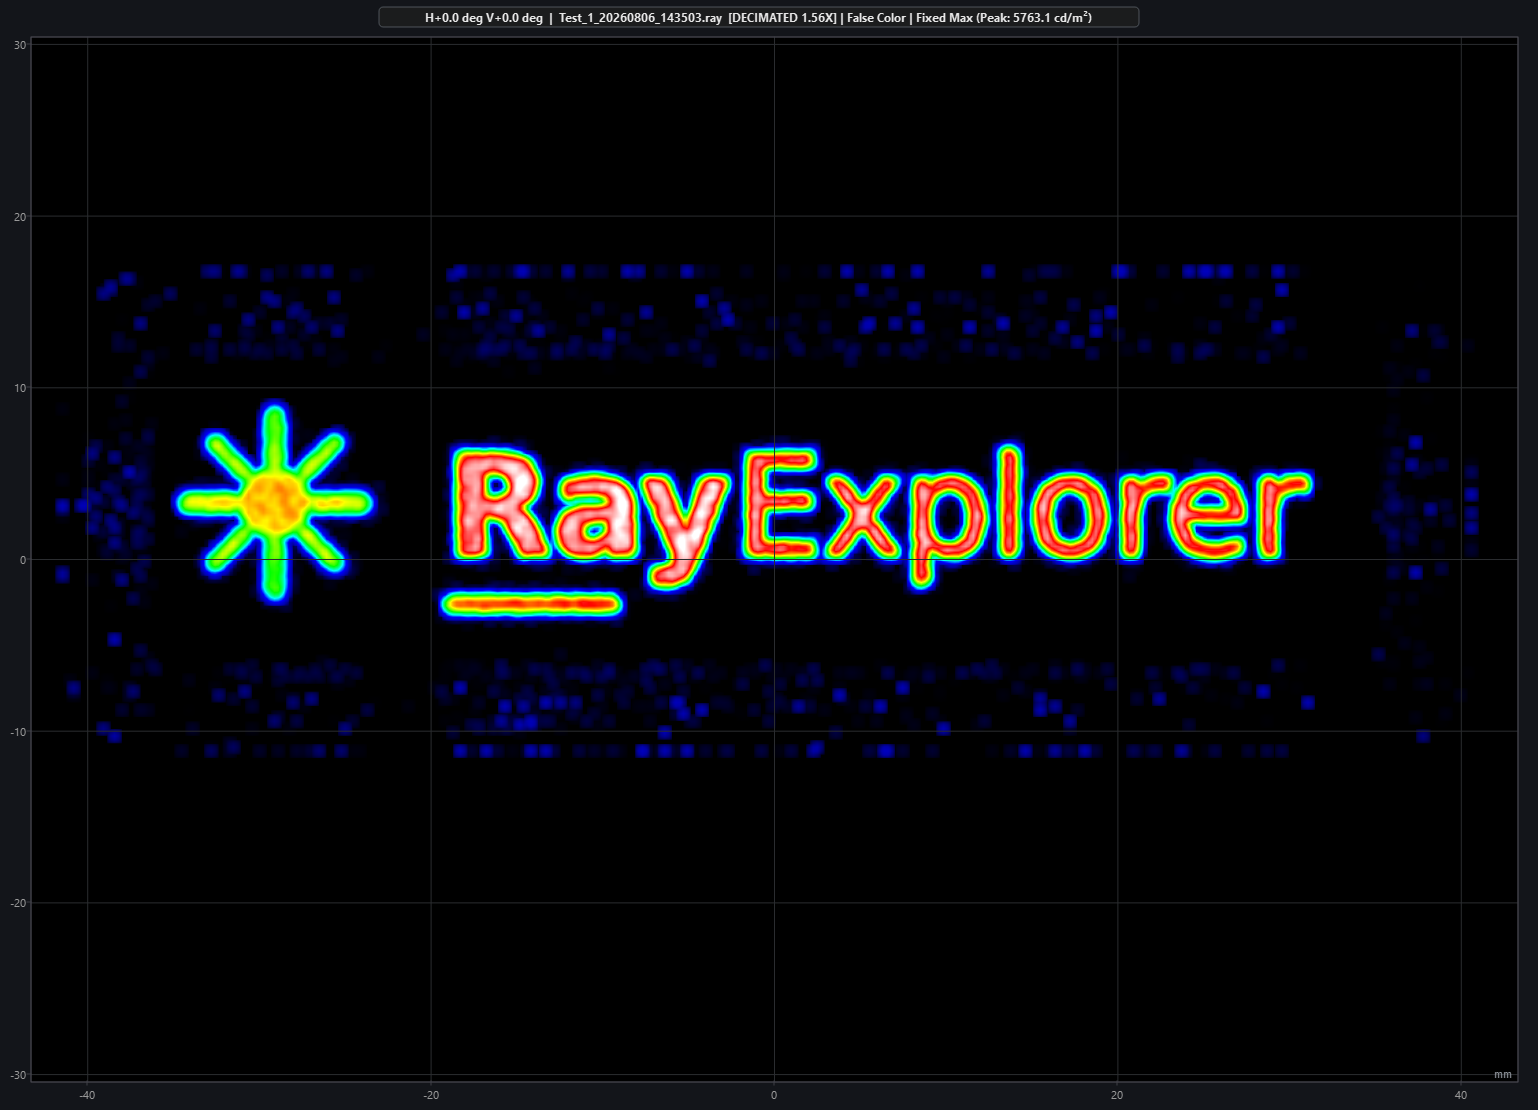
Interactive GPU viewport with a measured 58 FPS reference case. Load multi-file ray sessions, rotate virtual sensors, extract cross-section luminance profiles, compute 2D FFT homogeneity ripple in cycles/mm, and process supported camera RAW files through selected calibration profiles.

58 FPS Reference Test 2D FFT Homogeneity CIE 1931 Chromaticity RAW CR2/CR3/DNG Calibration
Enter Near-Field Workspace
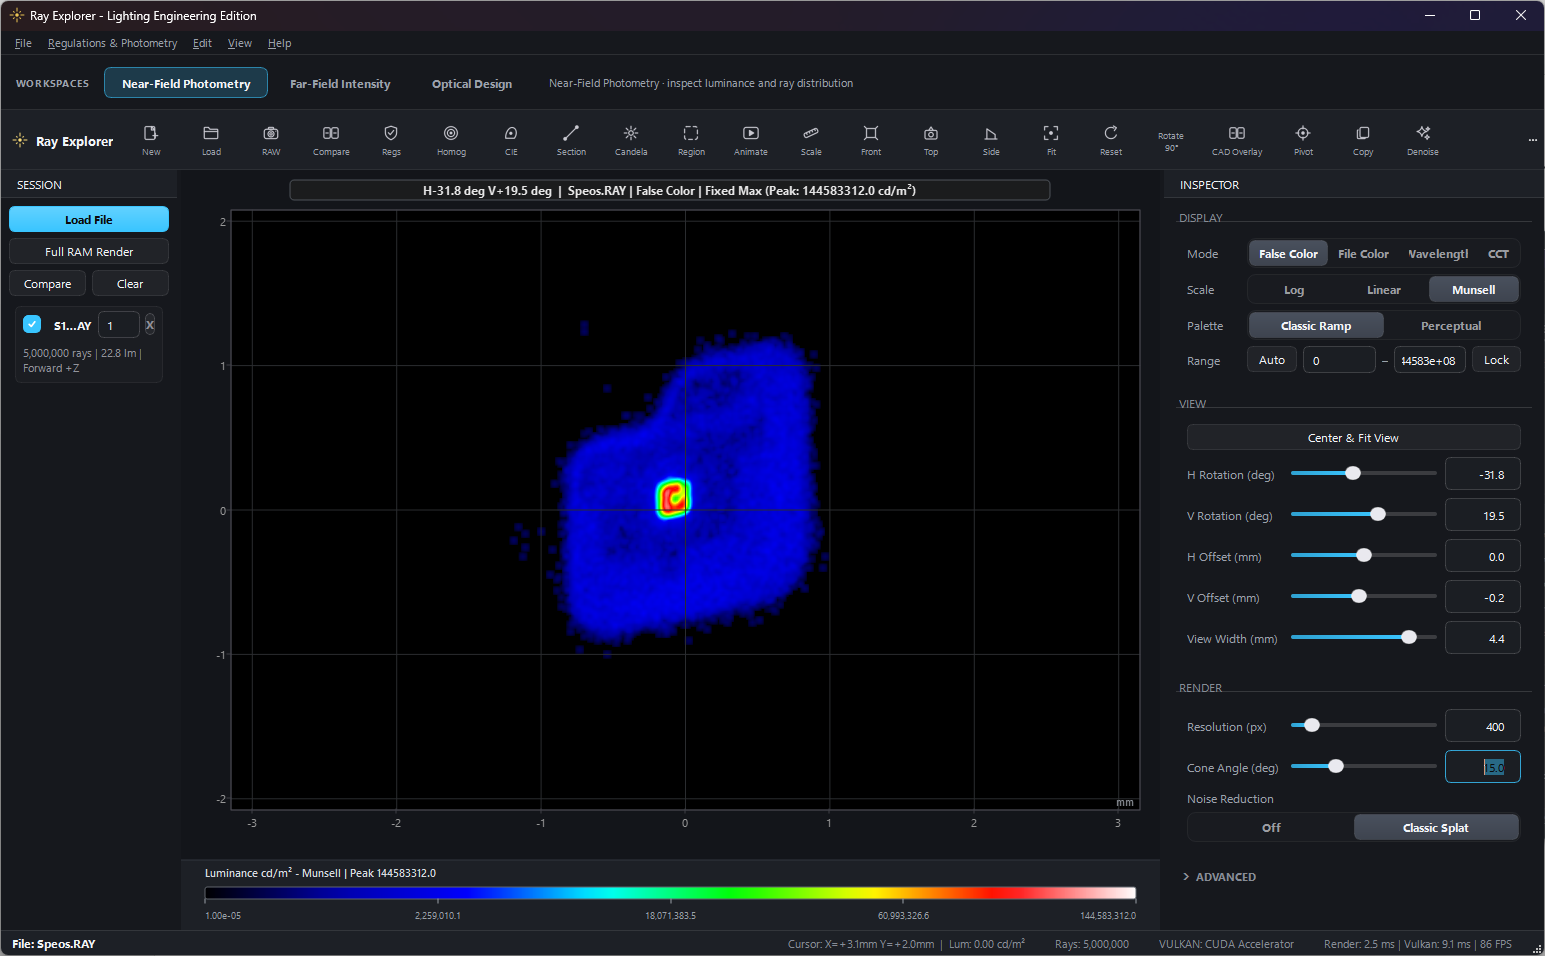
Ray Explorer Near-Field Workspace Overview
Near-Field Photometry Workspace

Look closer without losing the whole picture.

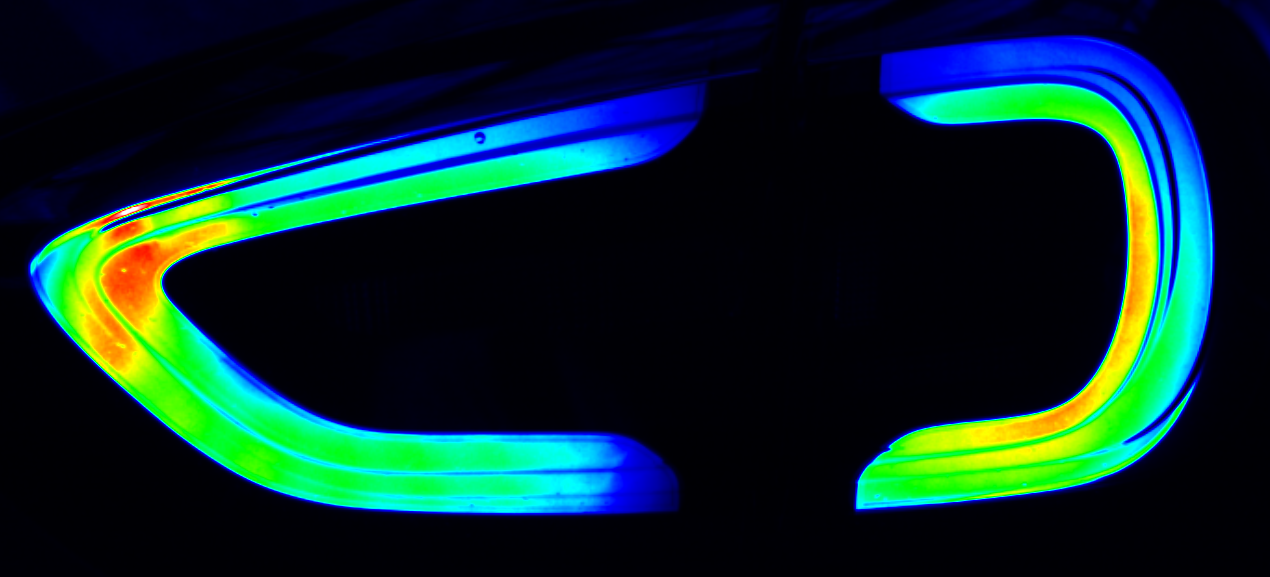
A high-performance inspection workspace for optical ray databases, direct 2D luminance grids, and calibration-aware camera-derived maps—built for optical engineers.

OPTIONAL GPU-RESIDENT PRESENTATION PATH

Supported frames can stay on the GPU.

On compatible Windows/NVIDIA systems, the optional Vulkan/CUDA presenter keeps supported near-field frames in GPU memory through tone mapping and presentation. OpenGL is the normal native fallback, with a software renderer available when native OpenGL cannot start.

  • No Per-Frame Host Image Readback on the Supported Vulkan Path: Exported GPU memory and external semaphores transfer ownership of the shared frame. A lazy NumPy readback occurs when a CPU measurement or export feature requests an array.
  • Physical GPU Matching: CUDA and Vulkan are matched to the same physical GPU. If they do not match, Ray Explorer refuses the Vulkan path instead of silently introducing a slow cross-adapter copy.
  • Explicit Fallbacks: Unsupported modes or Vulkan initialization/presentation errors fall back to OpenGL; software startup mode can use the Matplotlib renderer.
MEASURED VIEWPORT TEST — REFERENCE CONFIGURATION, NOT A HARDWARE GUARANTEE
Dataset13.3M Rays
Frame Rate58 FPS
GPU Render4.0 ms
Vulkan Present13.3 ms
Measured 58 FPS rotation of 13.3 million rays in the Ray Explorer GPU viewport
Live Viewport Test: 13.3M rays interactively rotated at 58 FPS on RTX A2000
01 / PROFILES

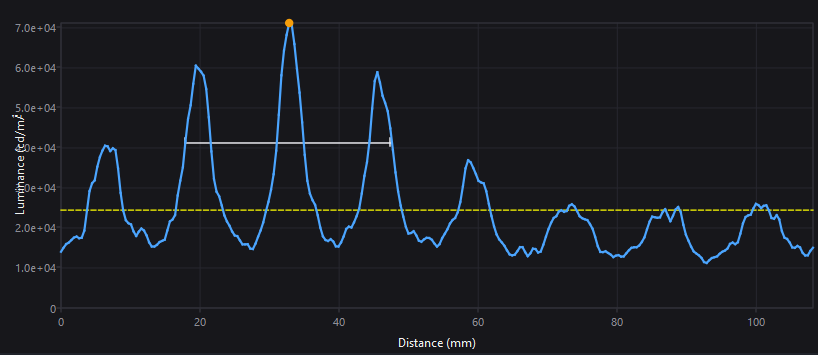
Luminance Section Profile

Build luminance profiles from selected cross-sections. Calculate beam falloff, peak luminance, and transition gradients from the active floating-point frame across physical distance in millimetres.
Luminance cross-section profile graph in Ray Explorer
Luminance Section Profile ($\text{cd/m}^2$ vs mm)
Engineered Truth: Measurements remain linked to the underlying luminance data—not the false-colour image displayed on screen.
02 / ROIs

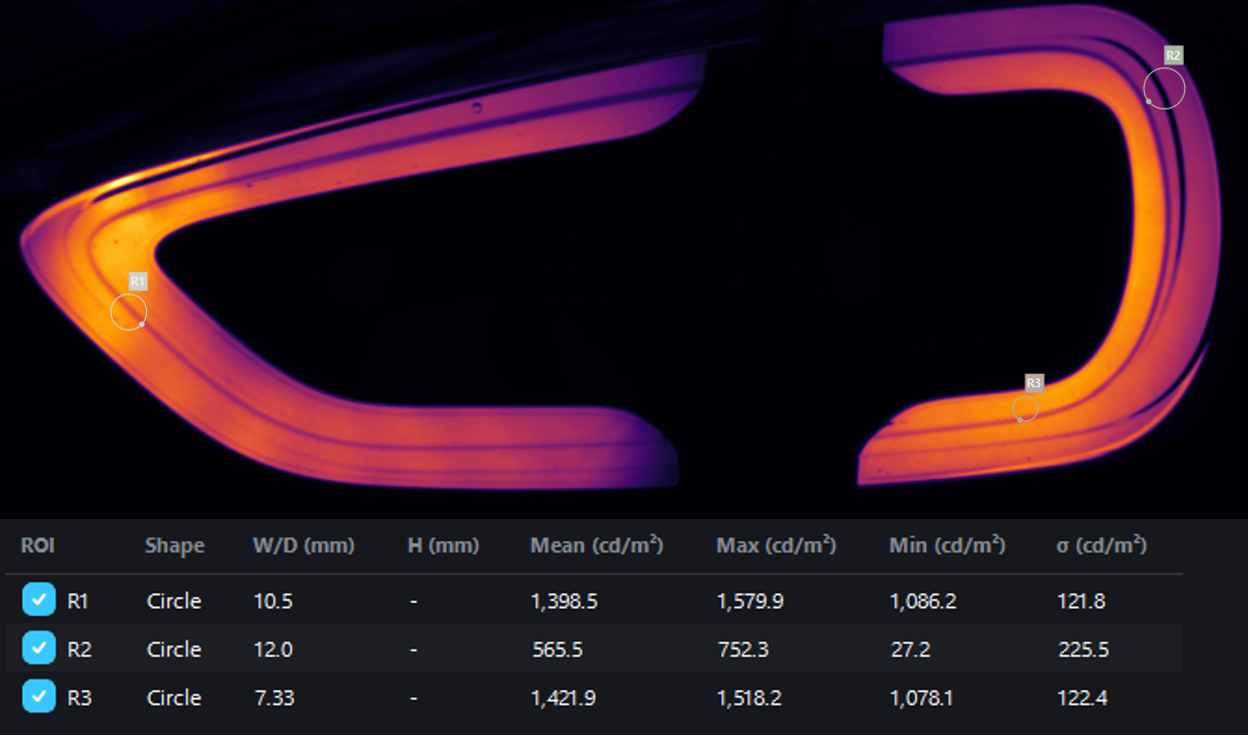
Multi-Region Statistics

Measure rectangular, circular, and polygonal regions. Calculate area averages, peak luminance, minima, standard deviation, and a geometry-dependent candela estimate from a selected viewport area.

Multi-region statistics and polygonal ROI measurement UI
Polygonal, Circular & Rectangular ROI Metrics
Candela Estimation: Uses the selected projected area, view geometry, and underlying floating-point luminance data.
03 / COLOR ANALYSIS

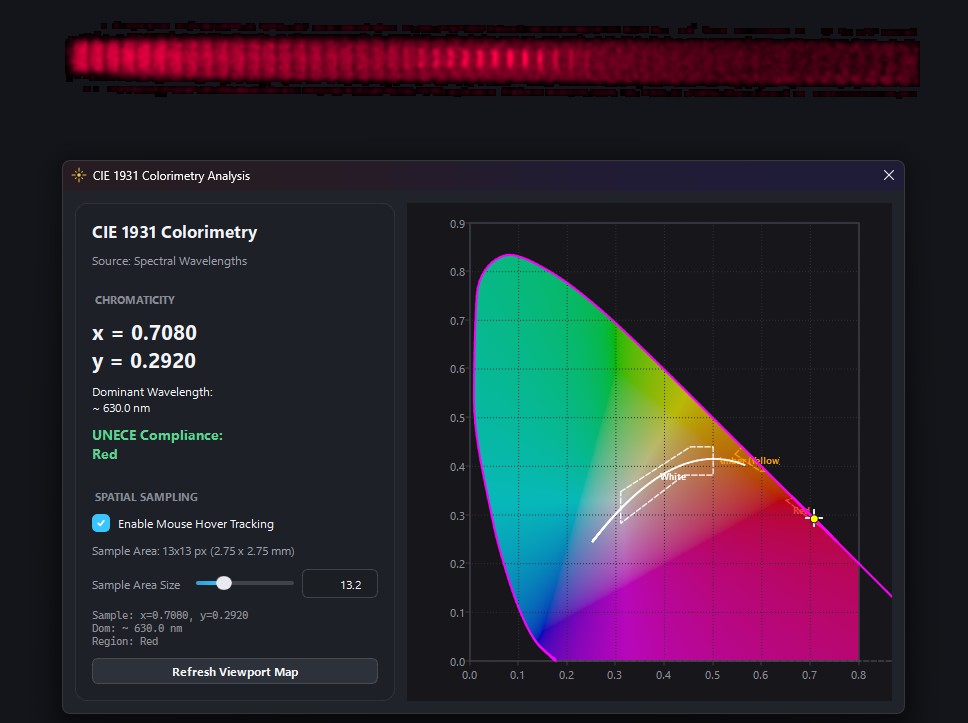
CIE 1931 Colour Analysis

Inspect colour using CIE 1931 tools and live viewport sampling. Sample chromaticity coordinates $(x, y)$, $(u', v')$, CCT in Kelvin, and inspect spectral ray distributions.

CIE 1931 chromaticity diagram and spectral color analysis
CIE 1931 Chromaticity & Spectral Viewport Sampling
Spectral Data: Preserves supported wavelength records from traced or imported ray files for colour analysis.
Ray Explorer preview ray sample and adaptive decimation visualization
Adaptive preview decimation with deterministic sampling and exact flux compensation
ADAPTIVE PREVIEW DECIMATION

Fast for exploration, complete for full-data accumulation.

Ray Explorer adapts the resident preview to available GPU memory when necessary, while retaining a separate complete-file accumulation path.

Deterministic Photometric Flux Correction
$$\Phi_{\text{sample}} = \Phi_{\text{ray}} \cdot \left(\frac{N_{\text{total}}}{N_{\text{preview}}}\right)$$

Every retained ray is weighted by the exact source-to-preview ratio. This preserves aggregate flux weighting for the deterministic sample; it does not remove spatial sampling error from a reduced preview.

  • Hardware Case Study: 2.5 GB optical ray database on an NVIDIA RTX A2000 (4 GB VRAM) applies a 1.56× adaptive decimation (retaining ~64% of rays) for fluid exploration.
  • Full RAM Render: Streams the complete ray file through bounded GPU batches for complete-data accumulation when the resident preview is reduced.
  • Why Decimation is Necessary: On-disk size is not the same as GPU-memory usage. Decoded origins, directions, flux, and colour arrays must coexist with rendering buffers and available VRAM headroom.
HOMOGENEITY & 2D FFT ANALYSIS

Reveal non-uniformity the eye can miss.

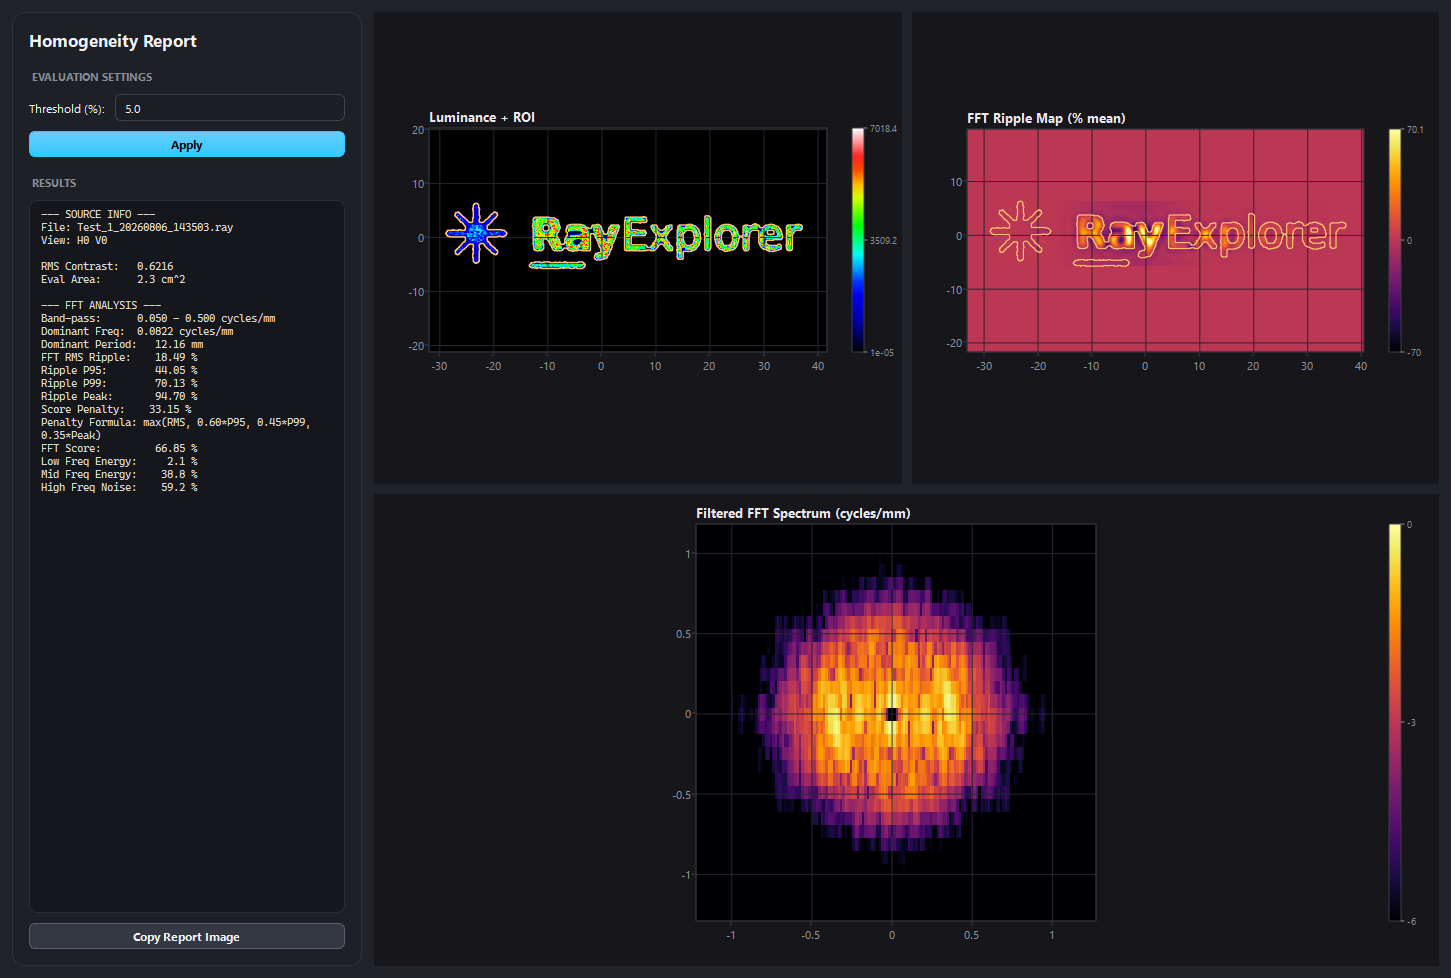
Ray Explorer evaluates the active luminance region in both the spatial and frequency domains, revealing not only how much variation exists, but also its scale and physical structure.

Dominant Period ($T$) $$T = \frac{1}{f}$$ Calculates physical period in mm from frequency in cycles/mm
RMS Ripple & Deviation RMS / Peak Quantifies structural luminance modulation
Percentile Ratios P95 & P99 Isolates localized hot/cold spots from background noise
Homogeneity Score Reported Summarises broad gradients and spatial ripple metrics
Frequency Becomes Physical Spacing: The dominant period is calculated as $T = 1/f$, allowing detected ripple to be compared directly with source spacing, lens pitch, or other repeating optical structures.
Homogeneity analysis showing isolated illuminated ROI, reconstructed ripple map, and spatial-frequency FFT spectrum
Luminance ROI $\rightarrow$ Reconstructed Ripple Map $\rightarrow$ Filtered Spatial-Frequency Spectrum
STEP 01 / NORMALIZATION

Scale-Independent Ripple

Converts pixel luminance $L(x,y)$ into fractional deviation $\delta(x,y) = \frac{L(x,y) - \bar{L}}{\bar{L}}$, ensuring metrics evaluate percentage ripple independently of absolute light output.

STEP 02 / 2D WINDOWING

Spectral Leakage Guard

Multiplies the active ROI by a separable 2D Hann window, eliminating artificial high-frequency boundary discontinuities before applying the Fast Fourier Transform.

STEP 03 / BAND-PASS

Isotropic Butterworth Filter

Applies a smooth order-2 band-pass filter from $0.05$ to $0.50\text{ cycles/mm}$ ($2\text{ mm}$ to $20\text{ mm}$ physical period), suppressing broad macro falloff and pixel sensor noise.

STEP 04 / PHYSICAL PITCH

Dominant Period $T = 1/f$

Maps the radial spectrum power peak directly into physical spacing in millimeters, allowing detected ripple to be compared with optical pillow pitch or LED array spacing.

FFT Homogeneity Report — Mathematical & Engineering Methodology 6-PAGE TECHNICAL REPORT
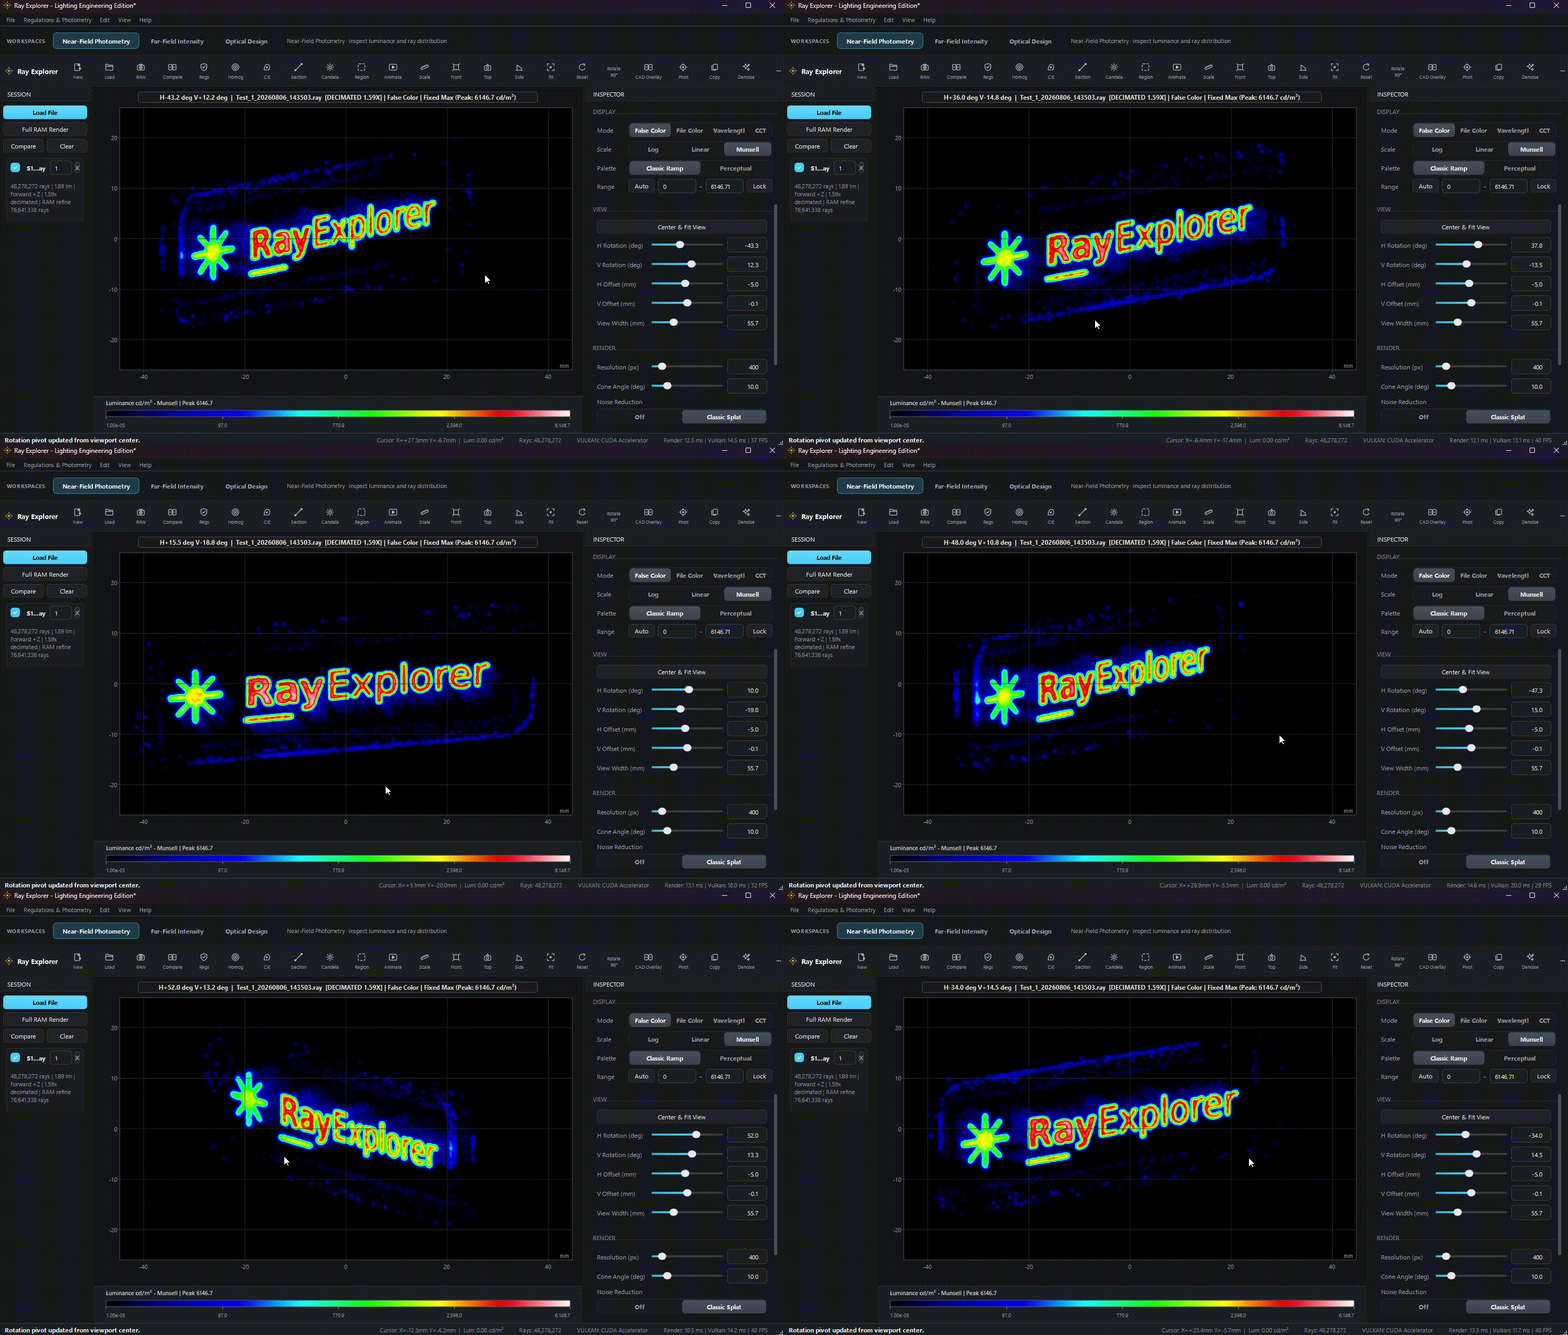
PRESENTATION-READY MOTION

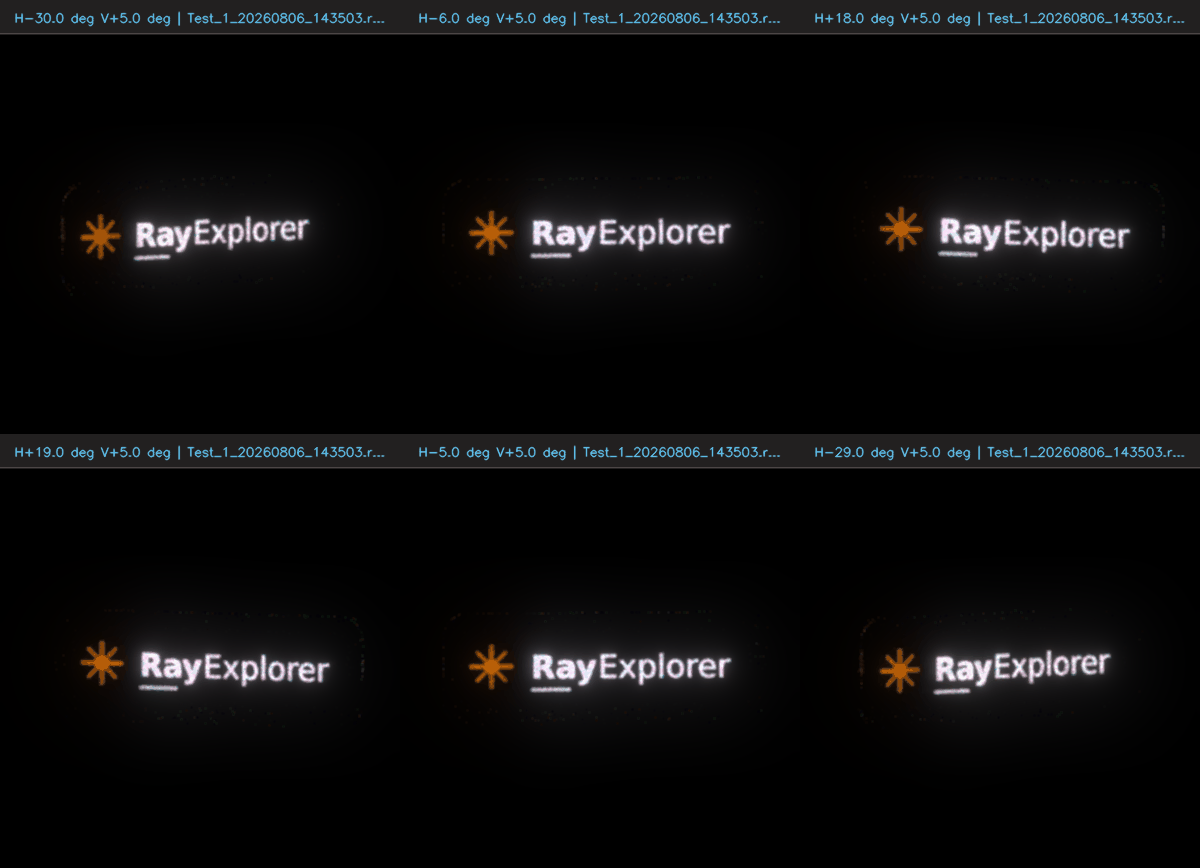
Turn any viewport into a shareable animation.

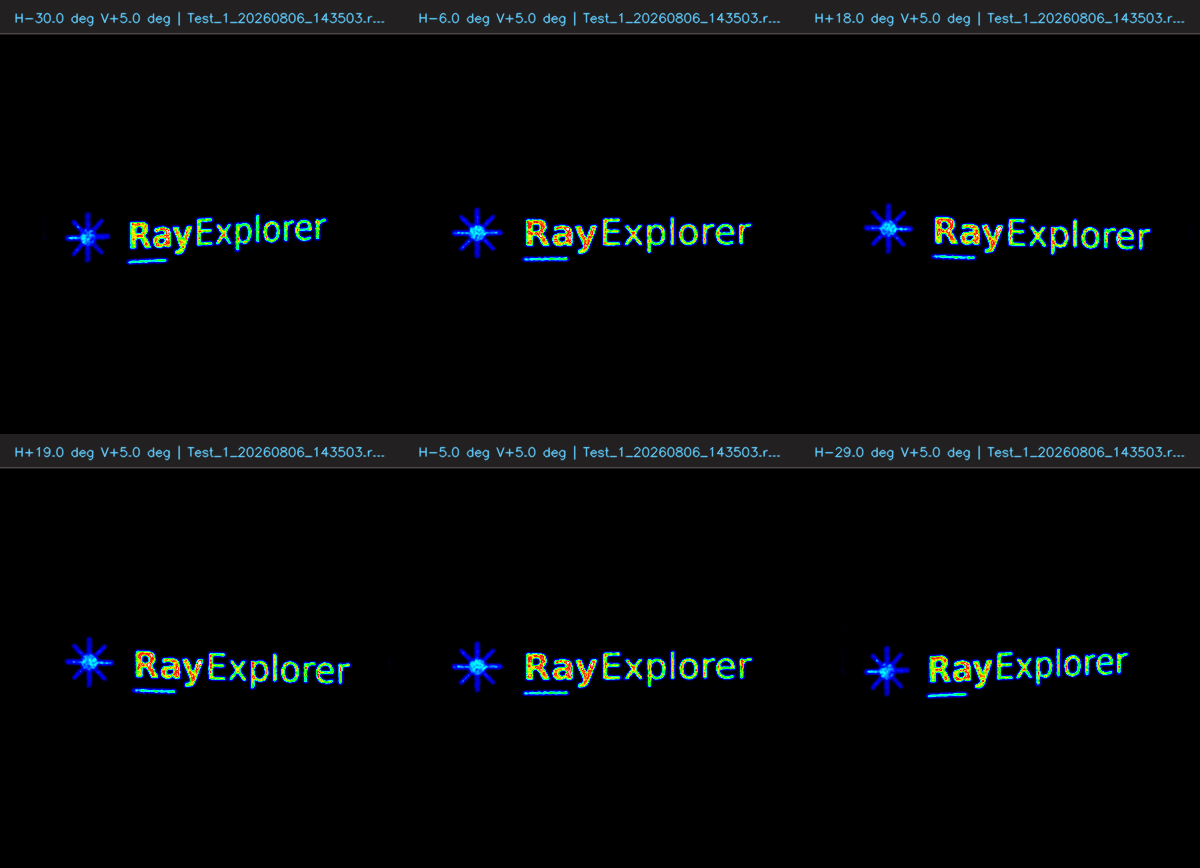
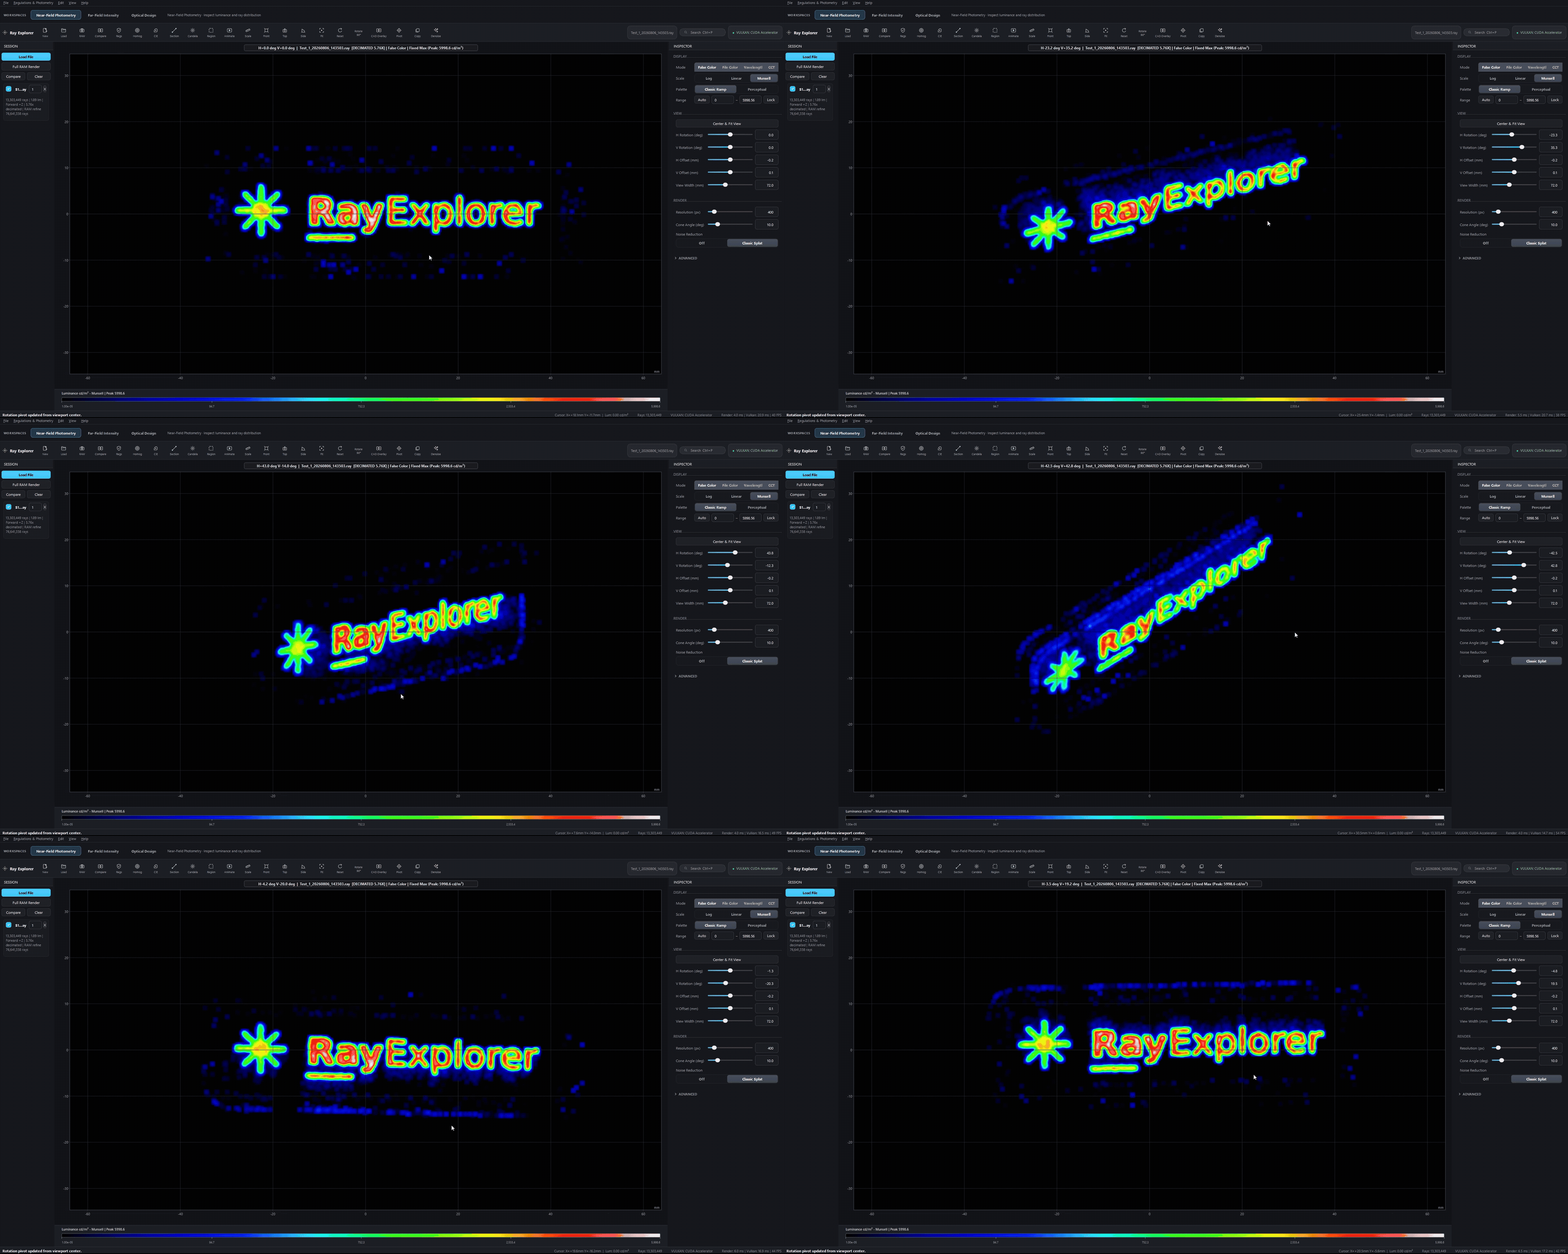
Ray Explorer automatically renders a controlled angular sweep from the underlying ray data—without screen recording or manual frame capture. Every frame is freshly rendered and labelled with its viewing angles, display mode, and peak luminance. Scaling remains fixed throughout the sequence, preventing misleading brightness changes between frames.

Angular Control: Define horizontal range, vertical angle, and angular step
Dual Format: Export MP4 video and continuously looping GIF
Intel OIDN: Optionally denoise every frame using Open Image Denoise
Synchronized Compare: Generate synchronized side-by-side animations
DATA INGESTION & COMPATIBILITY

One workspace for simulated and measured light.

Ray Explorer brings optical ray databases, luminance maps, and camera-derived engineering captures into the same near-field analysis workflow. Supported binary variants are identified automatically from headers and record structures rather than filename extension alone.

.ray Standard and spectral .ray variants with wavelength & flux
.ltrf / .dat LucidShape / binary LTRF ray records with auto-header sniffing
.dis ASAP-compatible directional & spatial distribution sets
.txt / .npz Direct 2D floating-point luminance grids with physical scaling & XYZ
CAMERA LUMINANCE · CALIBRATION-AWARE CAPTURE

Turn supported RAW captures into engineering luminance maps.

Ray Explorer processes supported DSLR and mirrorless RAW captures (.CR2, .CR3, .DNG) through camera-specific calibration profiles to produce quantitative $\text{cd/m}^2$ luminance and CIE chromaticity maps for rapid engineering analysis.

DEDICATED LAB WORKFLOW

Dedicated ILMD Systems

Purpose-built measurement hardware
  • • Established calibrated laboratory workflow
  • • Dedicated equipment and controlled capture setup
  • • Shared laboratory capacity may limit rapid iteration
  • • Remains the reference route for formal validation
RAY EXPLORER CAMERA LUMINANCE

Calibrated Camera + Ray Explorer

Build on compatible RAW equipment
  • ✓ Reuses supported camera bodies when a validated profile is available
  • ✓ Direct 14-bit linear Bayer sensor decoding (bypasses sRGB tonemapping)
  • ✓ Automated EXIF normalization ($t_{\text{exp}}$, $f/\#$, ISO sensitivity)
  • ✓ Flat-field lens shading correction & 3D LUT to CIE $XYZ$ and $\text{cd/m}^2$
  • ✓ Calibration workflow based on known reference targets
01 / RAW SENSOR CAPTURE
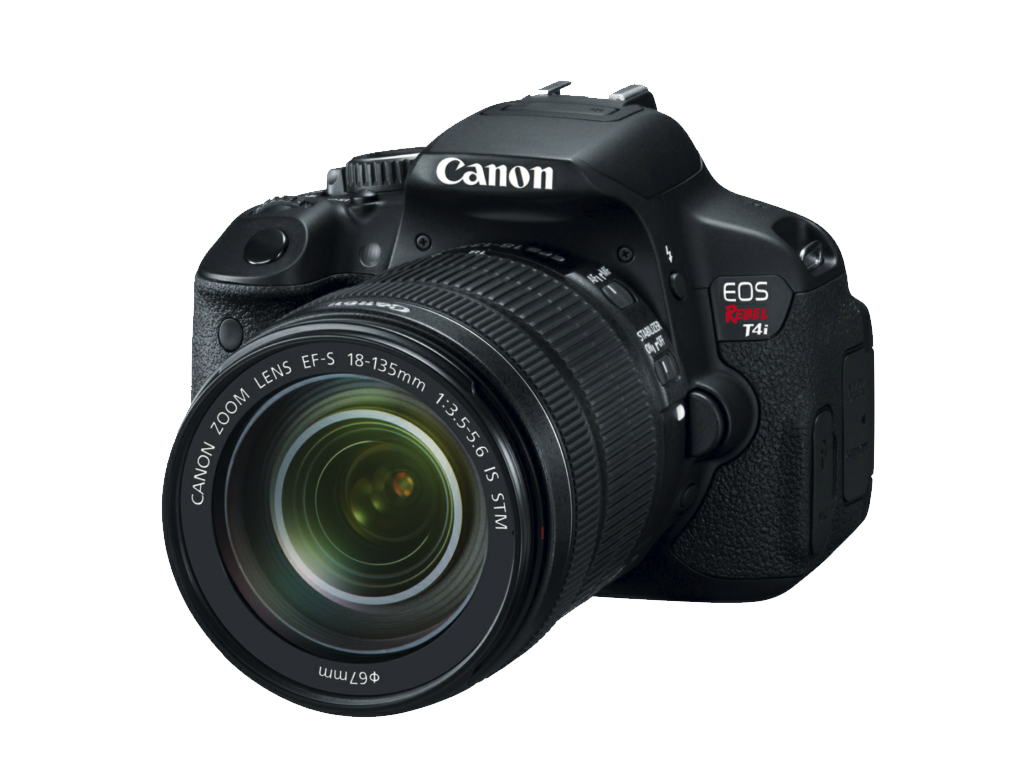
Standard consumer digital SLR / mirrorless camera
14-Bit Linear Bayer RAW Canon .CR2/.CR3 · Adobe .DNG
Calibration-Aware Pipeline
Vignetting + Grey Ref + 3D LUT
02 / CALIBRATED LUMINANCE FIELD
Calibrated 2D false-colour luminance distribution in cd/m2
Calibrated $\text{cd/m}^2$ Luminance Field CIE 1931 Chromaticity Coordinates
01

Uncompressed Sensor Read

Bypasses consumer picture styles, non-linear gamma curves, and lossy JPEG compression to read true linear sensor photoelectron counts.

02

Automated EXIF Normalization

Extracts shutter time ($s$), aperture ($f$-number), ISO gain, and focal length from header metadata to normalize radiometric exposure.

03

3D LUT & Target Calibration

Applies flat-field radial falloff correction, known-target reference scaling, and spectral 3D LUT matrices to map camera RGB into calibrated CIE $XYZ$ estimates.

04

Saturation & Clipping Guard

Detects sensor pixel saturation and blooming that could compromise peak luminance, exporting an auditable .npz package with full telemetry.

Target Calibration Prerequisite: To establish quantitative radiometric accuracy, consumer cameras must be calibrated against known reference targets (such as calibrated diffuse reflectance grey targets, uniform integrating spheres, or reference spot photometers) to account for individual sensor quantum efficiency, lens vignetting, and spectral response.

Explore the focused camera-luminance workflow
Far-Field Workspace

From rays to candela—correctly.

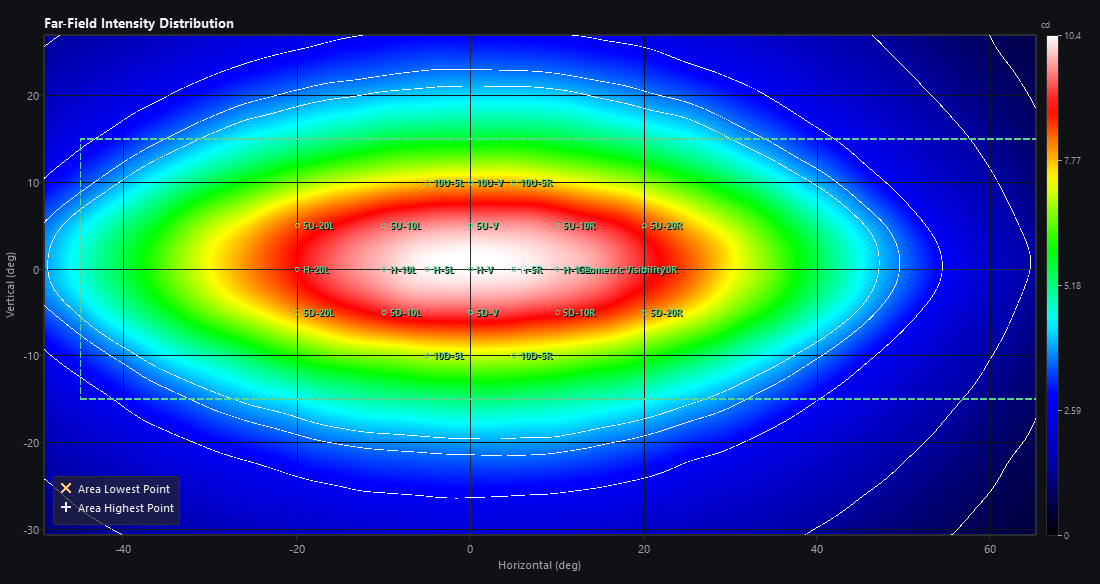
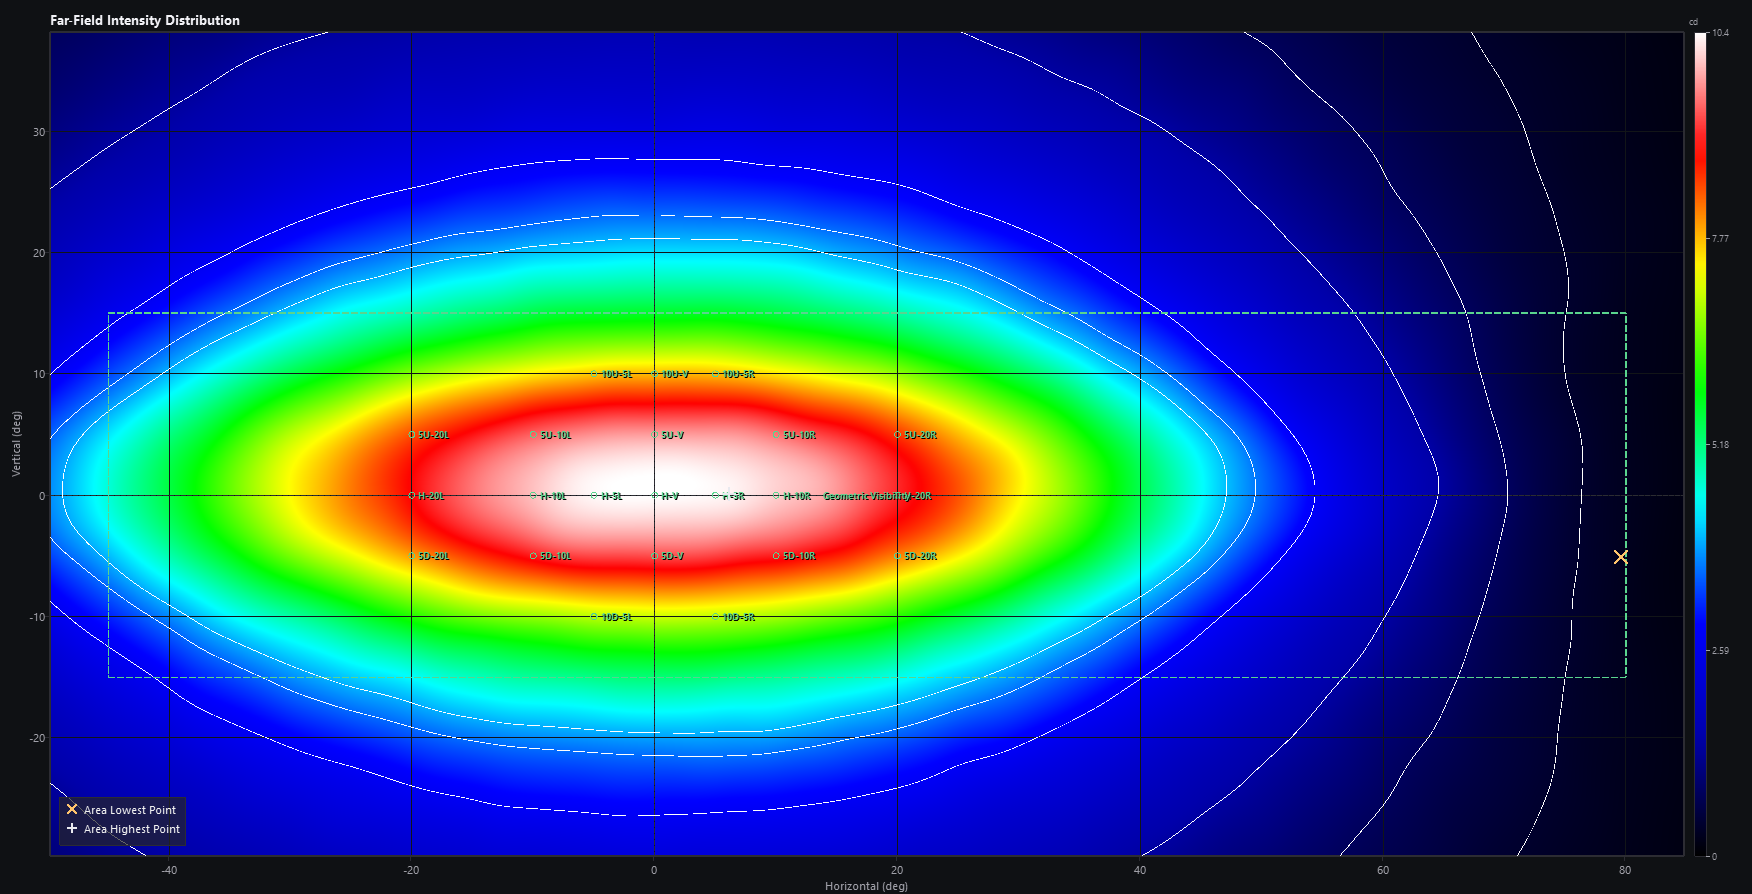
Ray Explorer projects ray directions onto a horizontal and vertical angular grid, then converts accumulated luminous flux into intensity in candela with solid-angle correction.

SOLID-ANGLE NORMALIZATION

Convert a ray database into an engineering-ready intensity map.

Bin directions, accumulate luminous flux, and apply solid-angle correction across the distribution:

The Essential Calculation:
$$I = \frac{\Phi_{\text{bin}}}{\Omega_{\text{bin}}} \quad (1\text{ candela} = 1\text{ lumen per steradian})$$

Why Solid Angle Correction is Essential: Equal angular increments do not represent equal solid angles. Without correction, intensity becomes increasingly biased away from the optical axis.

GPU Acceleration When Available Configurable H/V Angular Grid Cached Completed Maps
Far-field intensity distribution map in candela
Near-field ray database $\rightarrow$ Bin directions · accumulate flux · correct solid angle $\rightarrow$ Far-field intensity map in candela
ROAD PERFORMANCE MODEL

From candela distribution to road performance.

Ray Explorer projects the far-field intensity distribution onto a configurable road model, translating angular candela data into road illuminance and driver-view luminance.

  • Configure lamp height, spacing, aim tilt, and road dimensions
  • Select right- or left-hand traffic and position the vehicle within its lane
  • Combine independent left/right sources or generate a mirrored second lamp
  • Display a bird’s-eye illuminance map in lux
  • Render the driver’s perspective in luminance or ground illuminance
  • Inspect distance, road position, beam axis, and isoline behaviour
Road Illuminance Formula
$$E = \frac{I \cdot \cos\alpha}{r^2} \quad (\text{lux})$$

Road illuminance depends on both distance ($r$) and incidence angle ($\alpha$).

Bird's-eye road illuminance map in lux (0 to 120m)
Bird’s-eye road illuminance false-colour lux distribution (0m to 120m forward distance with isolines and lateral lane position)

Engineering pre-check only—not type-approval evidence: Confirm the applicable regulation series, supplement, device class, traffic side, and installation conditions before homologation.

PHOTOMETRIC TARGETS

Evaluate regulatory targets before the test lab.

Ray Explorer applies selected bundled UNECE engineering interpretations—or user-authored target definitions—to the raw far-field intensity map, showing where configured limits are met and where design margin is limited.

  • Overlays Targets on H/V Map: Positions required test points, cutoff lines, and evaluation zones directly over the intensity distribution.
  • Comprehensive Measurements: Measures point intensity, zone minima and maxima, and peak values.
  • Grouped & Dependent Rules: Evaluates grouped sums, dependent limits, and mirrored target layouts.
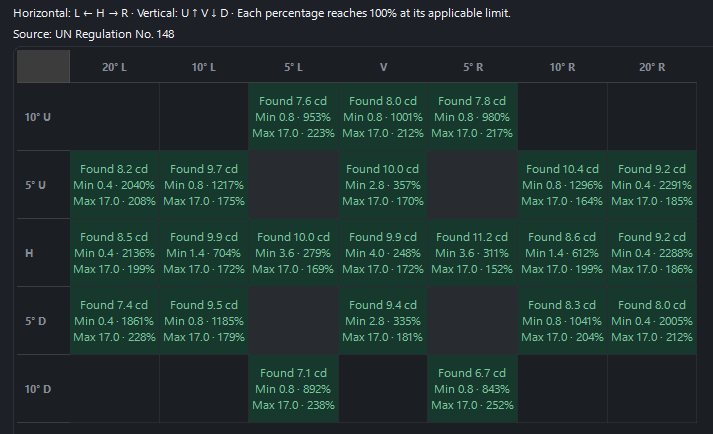
  • Percentage Achieved: Reports required versus measured candela and percentage achieved at each coordinate.
  • Automated Summary: Produces a pass, warning, or failure result against the selected engineering definition.
Unsmoothed Data Integrity: Display smoothing, colour scaling, and isolines never affect the result. Evaluation always uses the underlying unsmoothed candela map.

Bundled definitions are selected engineering interpretations, not authoritative regulation text or type-approval evidence. Verify the applicable series, amendments, class, traffic side, installation conditions, and national adoption before homologation.

Required points, lines, and zones positioned on the intensity map
Measured candela, applicable limits, and percentage achieved at each coordinate
Regulation Builder

Build photometric rules around your product.

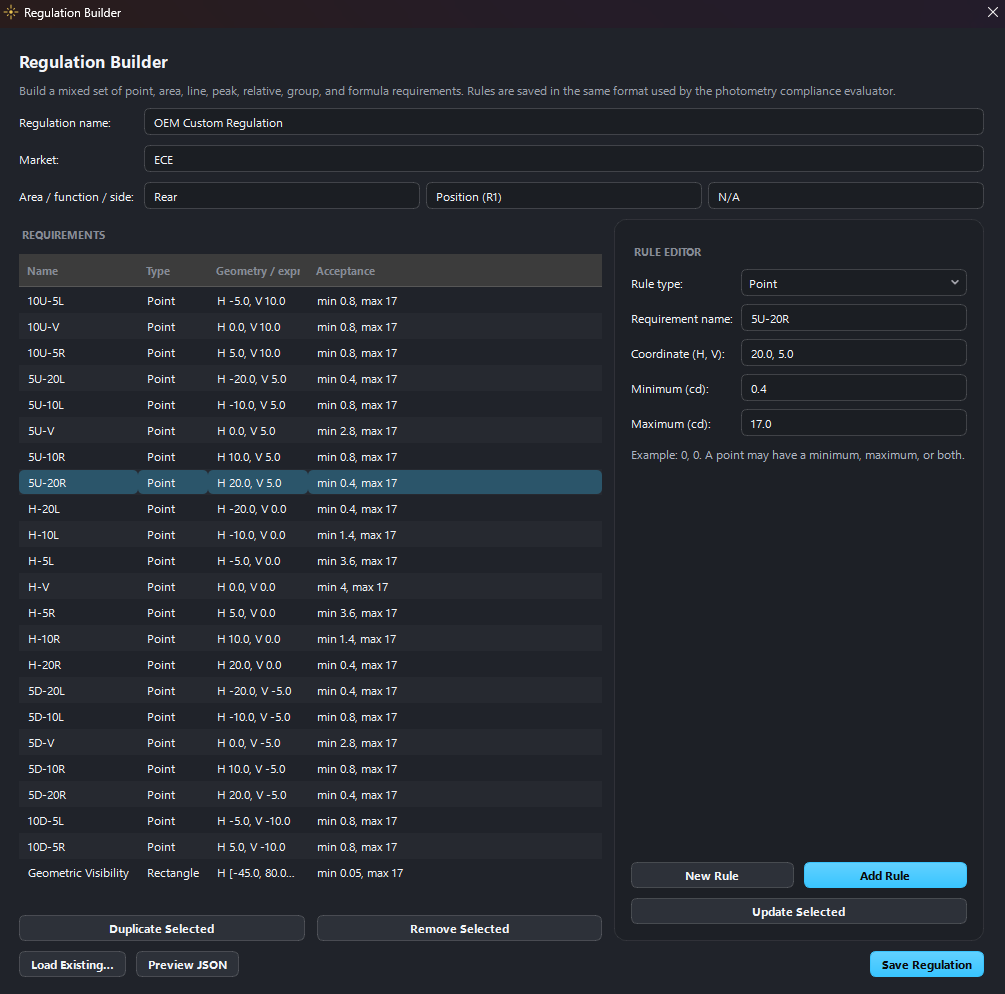
Ray Explorer’s Regulation Builder lets engineers combine geometric targets and derived acceptance rules in one reusable definition—without manually editing JSON.

VISUAL RULE EDITOR

Turn internal requirements into repeatable evaluations.

  • Create point, line, rectangular, and polygonal requirements
  • Search for peak intensity globally or within selected regions
  • Define minimum and maximum candela acceptance limits
  • Build custom formulas using measured results
  • Load, update, duplicate, and remove rules within the visual editor
SAFE RESTRICTED FORMULA LANGUAGE RESTRICTED EVALUATOR
mean(ref("Left"), ref("Right"))

Formulas can use arithmetic and the helpers ref, min, max, sum, mean, and abs, while arbitrary executable code is rejected.

Custom definitions represent internal or customer engineering criteria—not official regulations unless independently sourced, reviewed, and controlled.

Ray Explorer Regulation Builder screen
Regulation Builder Screen
Optical Design & GPU Ray Tracing Workspace

From geometry to photometric evidence.

Ray Explorer combines OCCT CAD topology, seven parametric optical feature types, defined optical materials, configurable light sources, and native NVIDIA OptiX tracing inside one project.

GEOMETRY INTEGRATION

Start from engineering CAD—or create the optic parametrically.

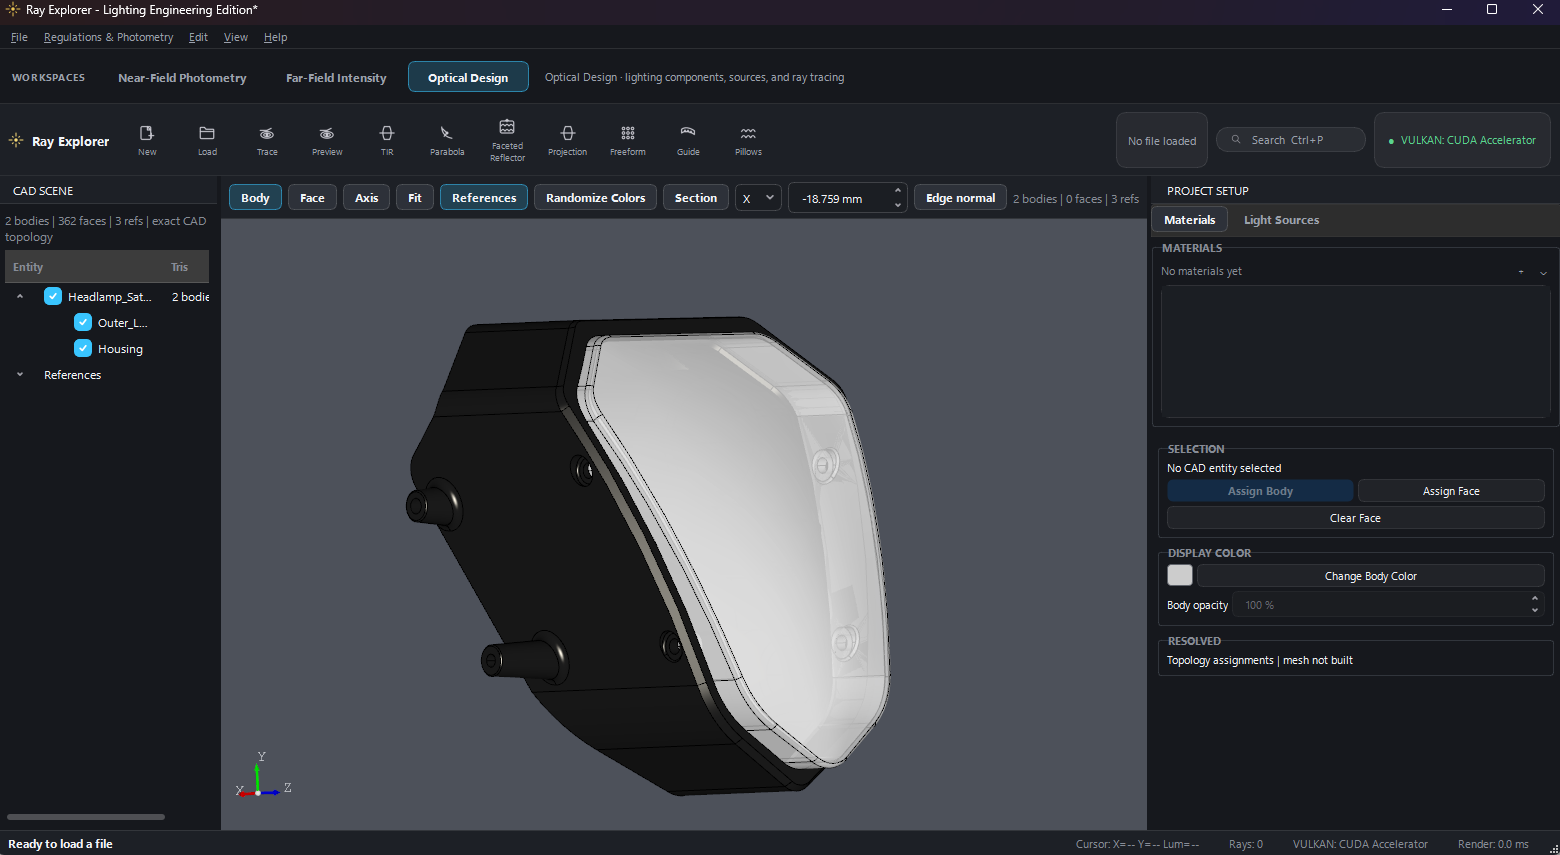
Ray Explorer supports two complementary design paths. Existing optical assemblies can be imported directly, while common optical components can be generated from editable engineering parameters.

Import Existing CAD:
  • Open STEP, IGES, and BREP geometry
  • Preserve exact body and face topology
  • Retain component structure & normalize units
  • Use bodies and faces for materials and sources
Create Optical Geometry:
  • Generate TIR lenses and parabolic surfaces
  • Build faceted reflectors and projection lenses
  • Create freeform lenses and light guides
  • Construct configurable optical-pillow arrays
Decoupled Trace Mesh: Ray Explorer preserves the exact CAD representation while generating a separate GPU-ready trace mesh. Simulation detail can be adjusted without replacing the underlying engineering geometry.
Optical design CAD assembly in Ray Explorer
Import Existing CAD Geometry · Create Parametric Optics
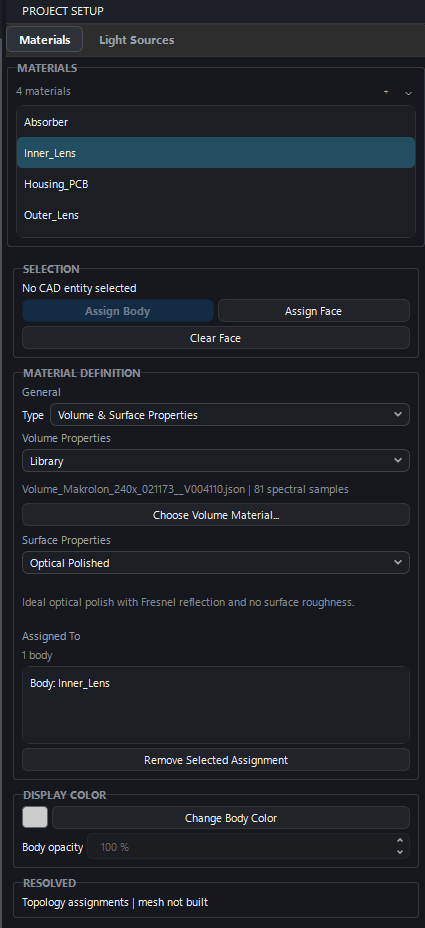
Optical material assignment screen
Material Assignment Screen · Select Versioned Optical Definitions
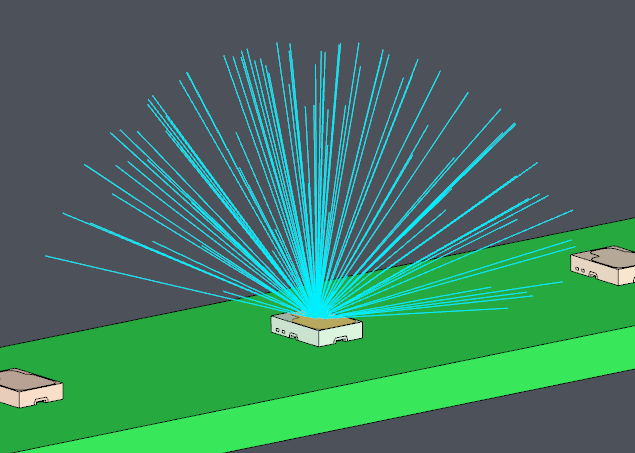
Light source definitions and preview rays
Light Source Definitions · Preview Sample Rays in Viewport
MATERIALS & SOURCES

Assign physical behaviour, not just appearance.

A viewport colour helps identify a component. Its optical material determines how light is reflected, refracted, absorbed, and scattered during simulation.

  • Choose opaque or transmitting volume models
  • Define refractive index $n$ and bulk absorption $\alpha$
  • Select mirror, ideal polished surface, rough-surface, or measured BRDF behaviour
  • Load spectral volume materials from the optical library
  • Assign materials to complete bodies or override individual faces
  • Create point sources with isotropic or cone emission
  • Turn selected CAD faces into Lambertian surface emitters
  • Import measured ray files preserving wavelength and flux data
  • Lock sources to CAD points, lines, and coordinate axis systems
Independent Display Physics: Display colour and opacity remain separate from the simulation model. Changing viewport appearance does not alter ray interactions.
NVIDIA OptiX Logo
NVIDIA OPTIX TRACING ENGINE

Trace complex optical paths with NVIDIA OptiX.

Ray Explorer converts the optical assembly into a GPU-accelerated tracing scene, then follows every path through successive material and geometry interactions.

GPU-Accelerated BVH Reflection · Refraction · TIR Rough Surfaces & Measured BRDF Beer–Lambert: $I = I_0 e^{-\alpha x}$ Wavelength Dispersion VRAM-Aware Batching
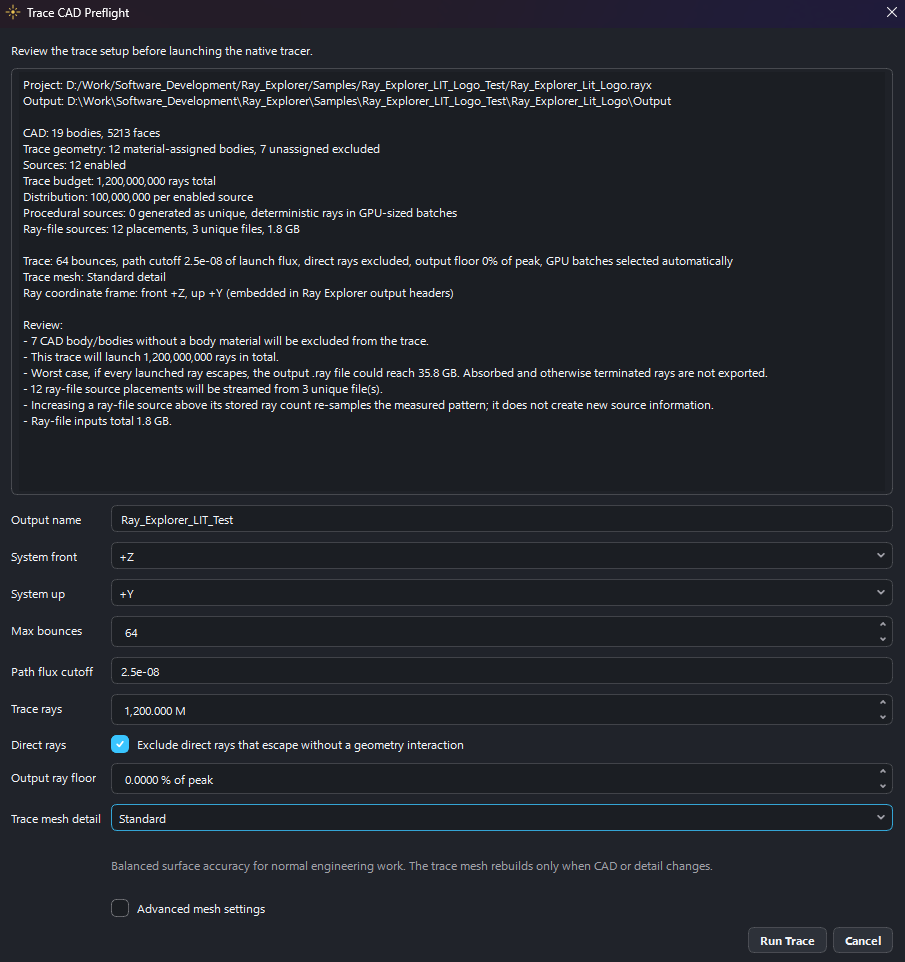
VRAM-Aware Batching: The requested ray count does not need to fit into VRAM as a single allocation. Ray Explorer selects a batch size from available GPU memory and can automatically reduce it and retry if memory pressure occurs.
Ray trace definition screen in Ray Explorer
Ray Trace Definition: Ray Count, GPU Batch Sizing & Bounce Limits
Simulation Audit Trail & Evidence

Every trace becomes evidence for the next iteration.

Ray Explorer produces more than a rendered result. Each completed simulation generates a reusable escaped-ray database and a companion engineering report describing how that result was produced.

01 Geometry & Sources CAD Topology · Materials · Emitters
02 GPU Trace OptiX BVH · Multi-Bounce · GPU Batches
03 Escaped Rays Position · Direction · Wavelength · Flux
04 Simulation Report Timing · Throughput · Conservation Stats
BENCHMARK: Ray_Explorer_Lit_Logo_Benchmark

Ray_Explorer_Lit_Logo_Benchmark

2026-08-06T14:45:53+01:00 · 2.0 Billion Ray Trace Run
Exported Rays 76,641,338 Valid escaped rays written to .ray
Exported Flux 1.8851 lm Flux carried by exported rays
Trace Rays 2,000,000,000 2.0 Billion launched rays
Elapsed Time 640.2 s 64 bounce limit · 10.6 min
Throughput 3.12 M rays/s Total launched / elapsed
Ray Yield 3.832% Exported / launched rays
Flux Efficiency 1.676% Exported / input flux
Geometry 837,843 tris 19 bodies · 0 open sheets
Boundary Issues 160,121 0.008006% escaped in medium
Engineering Warnings Detected During Trace:
  • Dielectric Boundary Escape: 160,121 ray(s) escaped while still inside a dielectric; check for a missing exit boundary or material assignment (Inner_Lens: 160,103 · Outer_Lens: 18).
  • Ray-File Resampling: One or more imported ray-file sources were re-sampled above their stored ray count; launched rays exceed the source's independent samples.

Run Configuration

Project FileRay_Explorer_Lit_Logo_Benchmark.rayx
CAD SourceRay_Explorer_Lit_Logo_Benchmark.rayx (19 bodies, 837k tris)
Output Ray FileRay_Explorer_Lit_Logo_Benchmark.ray (2.28 GiB)
Runtime Package.trace_runtime (Companion JSON metadata)
Max Bounces64 bounces
Path Flux Cutoff2.5e-08 (launch fraction)
Ignore Direct RaysFalse
GPU Batch Size8,000,000 rays / chunk (automatic)

Ray State Accounting

Escaped in Air (Valid)76,641,338 (3.832%)
Absorbed by Materials89,684,411 (4.484%)
Alive / Max Depth1,833,507,746 (91.675%)
Numerically Invalid6,384 (0.000319%)
Escaped in Medium160,121 (Inner_Lens: 160,103, Outer_Lens: 18)
Effective Input Flux112.50 lm
Exported Ray Flux1.8851 lm
Final Status Accounted2,000,000,000 (100.0%)

Sources — 12 placements summarized in 3 groups

Source / Pattern Qty Type Stored Rays Launched Total Sampling Input Flux Flux / Source Spectrum
rayfile_KW_SITRA1_SK_blue_5M.RAY 5 ray_file 25,000,000 833,333,335 resampled 2.048 lm 0.410 lm Monochromatic (550 nm)
rayfile_KW_SITRA1_SK_yellow_5M.RAY 5 ray_file 25,000,000 833,333,333 resampled 95.453 lm 19.091 lm Monochromatic (550 nm)
rayfile_KY_SITQA1_23_5M.RAY 2 ray_file 10,000,000 333,333,332 resampled 15.000 lm 7.500 lm Monochromatic (550 nm)

Optical Material Assignments

# Material Name Volume Model Definition / File Surface Model Boundary Trans. IOR ($n$) Abbe ($V_d$)
0 Inner_Lens Measured library Volume_Makrolon_240x.json Optical polished automatic_air 1.0 1.5850 27.58
1 Outer_Lens Measured library Volume_Plexiglas_8N.json Optical polished automatic_air 1.0 1.4932 57.00
2 Housing_PCB Opaque Housing_PCB Mirror surface_only 0.0 1.5000
3 Absorber Opaque Absorber Mirror surface_only 0.0 1.5000

JSON Simulation Log Schema (Test_1_20260806_143503.json)

Machine-Readable Audit Trail
{
  "format": "ray_explorer_simulation_log",
  "version": 4,
  "frontend": "Ray Explorer Standalone",
  "timestamp": {
    "local_iso": "2026-08-06T14:45:53+01:00",
    "utc_iso": "2026-08-06T13:45:53Z"
  },
  "simulation_name": "Ray_Explorer_Lit_Logo_Benchmark",
  "project_name": "Ray_Explorer_Lit_Logo_Benchmark",
  "output_ray_file": "Ray_Explorer_Lit_Logo_Benchmark.ray",
  "trace": {
    "elapsed_s": 640.20389,
    "max_bounces": 64,
    "flux_cutoff": 2.5e-08,
    "trace_rays": 2000000000,
    "ignore_direct_rays": false,
    "automatic_chunk_size_rays": 8000000
  },
  "sources": {
    "count": 12,
    "group_count": 3,
    "native_ray_count": 60000000,
    "traced_ray_count": 2000000000,
    "input_flux_lm": 112.500002
  },
  "geometry": {
    "body_count": 19,
    "triangle_count": 837843
  },
  "result": {
    "exported_ray_count": 76641338,
    "exported_flux_lm": 1.885102,
    "escaped_in_medium_count": 160121,
    "absorbed_ray_count": 89684411,
    "alive_ray_count": 1833507746,
    "invalid_ray_count": 6384
  },
  "statistics": {
    "million_rays_per_second": 3.124,
    "exported_ray_percent": 3.832,
    "flux_efficiency_percent": 1.676,
    "output_file_size_bytes": 2452522844
  }
}
Platform Specifications

Supported Formats & Hardware Compatibility

The current beta targets 64-bit Windows. GPU features depend on compatible NVIDIA CUDA/OptiX components, while near-field presentation can fall back from the optional Vulkan/CUDA path to OpenGL and, when requested, a software renderer.

Supported Optical Formats

Format Category Capabilities
.ray Ray Database Standard and spectral variants with wavelength and flux
.ltrf / .dat LucidShape / Binary LTRF ray records with automatic binary header sniffing
.dis ASAP Format Direction and spatial distribution coordinates
.txt / .npz Luminance Grids 2D floating-point grids; physical dimensions and XYZ are retained when present
.ies Far-Field Photometry IES ingest and export for angular intensity distributions
.CR2 / .CR3 / .DNG Camera RAW Metadata extraction, profile-based conversion, optional CIE XYZ LUT, and warnings
STEP / IGES / BREP CAD Geometry Exact body and face topology with trace mesh decoupling

System & Hardware Architecture

Component Specification Notes
Ray Tracing Core Built native OptiX bridge + compatible NVIDIA driver OptiX owns BVH traversal and ray/triangle intersection
GPU Presentation Optional Vulkan 1.1 path on Windows CUDA-written shared frame memory with external semaphore synchronisation
Fallback Pipeline OpenGL 3.3 Core; Matplotlib software mode OpenGL fallback after Vulkan failure; software startup mode remains available
Published Reference Test NVIDIA RTX A2000, 4 GB VRAM 13.3M-ray viewport measured at 58 FPS; performance varies by data and mode
Denoising Engine Optional pyoidn binding Explicit freeze-frame denoise and optional animation-frame denoise
Operating System 64-bit Windows desktop Portable onedir beta build; native components require release smoke testing

Current release boundary: the checked-in distribution path is an unsigned portable beta. Installer signing, code signing, SBOM generation, and release-specific validation remain separate release controls.

The Loop Stays Open

When the question changes, the data is still ready.

That is the product history in one line: build the optic, trace the light, inspect the same rays from a new viewpoint, convert them into photometric evidence, and carry what you learned into the next design iteration.

ENGINEERING PROVENANCE

Built by an optical engineer, for optical engineers.

Vitor Santiago

Creator of Ray Explorer · Optical Engineer & Software Developer

Vitor Santiago develops engineering tools at the intersection of automotive lighting, physical optics, and GPU-accelerated simulation. Ray Explorer grew from a practical objective: connect optical design, high-performance ray visualization, and photometric validation in one focused engineering workflow.

AREAS OF FOCUS
Automotive Lighting Optical Simulation Photometry GPU Computing Engineering Software
Vitor Santiago — Optical Engineer & Software Developer
VITOR SANTIAGO · OPTICAL R&D